Give me the bad news first.
“The city’s net financial position continues to deteriorate and our borrowing levels, although well within provincial limits, continue to increase. These are certainly causes of concern and need to be monitored closely going forward.”
That’s the conclusion from City of Revelstoke finance director Graham Inglis in his annual financial performance report, a document that compares Revelstoke’s bottom line with the provincial average and a set of communities of a similar size. (The report is embedded at the bottom of this story.)
Unfortunately, that’s not the end of the bad news; aside from a couple of glimmers of light, the report signals another year of increasingly dark clouds over the city’s financial picture when compared with other similar municipalities.
Inglis warns that city surpluses are low, and have been low for years – something he’s flagged in past reports. “This has been a consistent element of these reports and the city needs to do more to build reserves so that it can fund future infrastructure expenditure commitments with less reliance on borrowing,” he concludes.
He adds the city needs the money to pay for the most basic of municipal duties, like fixing roads.
The 2013 report, scheduled for discussion at council’s May 28 meeting, actually compares 2011 numbers – the latest available and compiled from municipalities across B.C.
Inglis slices and dices the numbers to compare and contrast, breaking them down into the following financial comparisons discussed below. It compares Revelstoke to a group of eight similar communities including Salmon Arm, Nelson, Quesnel, Merritt, Kimberley, Golden and Castlegar. This is the ‘comparison group.’
It also compares Revelstoke to all municipalities in B.C. with a population between 5,000 and 10,000. This is the ‘provincial average.’
Revelstoke lags behind the provincial average of just over $40 million in financial assets, with about $15.5 million.
Revelstoke’s financial liabilities – debts and obligations – were just below the provincial average, but were second highest amongst a comparison group. Revelstoke has about $25.7 million in financial liabilities.
Amongst the comparison group, Revelstoke had the third highest total liabilities per capita, amounting to about $3,500 per resident – man, woman, old or newborn.
In terms of net financial assets, in the comparison group, only Salmon Arm was more in the red. Revelstoke was in the hole for about $10.1 million, while Salmon Arm is about $13 million in the red.
Non-financial assets are assets like buildings, infrastructure and equipment that aren’t finance-based. Revelstoke had about $60.1 million of these assets, ahead of only Merritt in the comparison group. We’re well below the provincial average of about $210 million.
Tangible capital assets are physical assets minus what’s owed on them. Think of it as the value of your car minus the payments you still owe. Here, Revelstoke came in last amongst the comparison group with a total of about $41.4 million – and was well below the provincial average of over $200 million for communities our size.
As of the end of 2011, the total outstanding debt for Revelstoke was $18.2 million, up from $16.7 million a year before. In his report, Inglis warns this is almost double the provincial average and second-worst in the comparison group. “It is indicative of Revelstoke’s continuing reliance on borrowing as a method of funding its capital expenditure programme, in the absence of sufficient reserve funds or [development cost charges.]” He also noted infrastructure investment is contributing to the debt.
Revelstoke’s debt-to-total revenue ratio is 0.93, meaning debt is nearing the revenue value of 1. This was the second-worst in the comparison group, behind only Salmon Arm. The provincial average is about 0.28. In other words, it’s like your paycheque is $1,000 per week, but your mortgage, credit card and car payments and other debt payments added up to $930 a week – not much left over.
Accumulated surplus is the combination of equity in physical assets plus operating, capital and reserve funds. With just under $50 million, Revelstoke had about half of the average of the comparison group, and is many times below the provincial average of about $240 million.
In 2011, Revelstoke edged out 2010 leader Quesnel to become the most expensive municipality in the comparison group in terms of total taxation and grants-in-lieu at $1,476 per capita. This includes BC Hydro payments for tax-generating lands Revelstoke lost when dams were built and lands flooded. Minus this payment, the per capita would be $1,196.
Revelstoke had the third-highest total consolidated expenses amongst the comparison group. This is the measure of all expenditures for the function of a municipality, per capita. Revelstoke trailed Nelson and Kimberley with a total of $2,569 per capita, above the provincial average of about $1,800.
What’s driving the costs? Not really staff in city hall, including council, administration, IT and finance. Their combined expenses were just above average and ranked almost lowest in the comparison group.
Protective services, including fire, police, and bylaw enforcement spent about $535 per capita in 2011, the second-highest amongst the comparison group, and well above the provincial average of around $400.
Waste management and recycling was below the provincial average and amongst the lowest in the comparison group.
Development services includes costs related to economic development, the planning department, tourism and resort development. The two towns with new ski resorts stood out in this comparison. Golden led with about $210 per capita in costs, with Revelstoke next at $184 per capita. The rest of the pack hovered around the $50 mark, while the provincial average was about $90. In his report, Inglis notes the cost is partially offset by revenues in other categories, such as about $750,000 in hotel tax revenue in 2011.
Revelstoke is the runaway leader in transportation and transit costs, with a fare of $619 per person a year, well above the average of about $175 per capita. There’s an asterisk here; snow removal costs and snow equipment costs were high in 2011.
Parks and recreation costs were second-highest in the comparison group, totalling $410 per capita, up from $393 the year before. Revelstoke was shy of double the provincial average, but doesn’t benefit from recreation partnerships from neighbouring communities.
Water service costs were relatively low, but sewer service costs per capital again topped the comparison group, coming in most expensive at $163 per capita. Inglis attributed this cost to sewer lagoon desludging amounting to about $500,000 in 2011. Sewer costs per kilometre were highest in the comparison group and nearly double the provincial average.
Residential property taxes and charges combines all kinds of property taxes, including school, hospital, regional district and other tag-ons. Amongst the comparison group, based on an average residential assessment, Revelstoke came in the third-lowest, at around $2,700.
Inglis concludes his report with a warning about the City of Revelstoke’s financial picture and unsustainable borrowing.
Inglis writes: “The city also needs to build surpluses as part of its ongoing financial planning process so that it is able to finance future road rebuilding and road rehabilitation programmes without resorting to borrowing.”
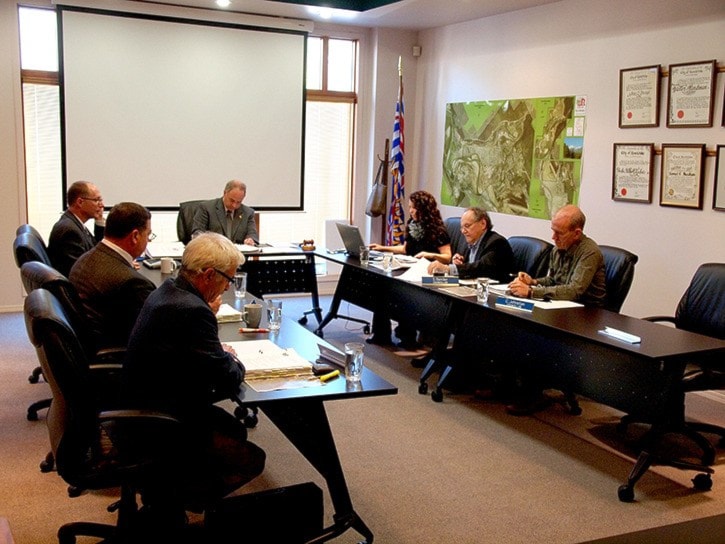
UPDATE: City council reacts to report
At their May 28 meeting, city councillors reacted to the financial performance report.
Acting Mayor Linda Nixon said the report is a useful assessment tool for council: "It helps us look at our net financial position, which is showing the negative, which means some strategic change had to happen, and that's what we made this year," Nixon said. "We need to look in two years to see if we've made a real significant switch in the direction the City of Revelstoke is moving."
Coun. Chris Johnston pointed out troubling trends: "It's cause for concern in some areas in terms of our per capita spending on certain areas and I think we need to be taking a look at it." He said council needed to heed the report. "In conclusion, it's not very encouraging. I think it's something council should take a good look at and do comparisons with other communities." He pointed out recreation, transit and protective services as examples of Revelstoke services that had high costs compared with other communities.
Coun. Steve Bender said the report was a valuable look at city finances: "I suggest anybody interested should at least read the summary at the back."
Coun. Tony Scarcella expressed concern over spending and debt. "I'm really worried. We haven't been addressing those concerns. I'm very concerned that the young generation cannot live in Revelstoke in the future."
Scarcella emphasized the numbers were from 2011 and the situation has continued to deteriorate, saying there is, "a lot of tax increases, a lot of spending that doesn't show up."
Coun. Gary Starling said he'd been reading this annual report since about 2007. "It's been fairly consistent – some of the worrisome areas – we seem to be not addressing them. I agree with councillor Scarcella; we're not addressing them aggressively enough – some of these issues that seem to be carried on year to year.
"I think council should be looking at this – at least back three or four years – and looking at the direction we're going because I don't think we're turning the ship around quick enough. There is some real interesting per capita costs here that are escalating.
"I would encourage the public to look at that as well and be more engaged and we can come up with some creative solutions [about] how to fix it," Starling said.
Revelstoke Financial Performance Report 2013 by AaPOrlando